
SEO ROI is easy to calculate badly and hard to calculate honestly. Pull one number out of GA4, divide it by what you paid an agency, publish the multiple, move on. That’s the version most ROI calculator pages hand you.
The honest version is messier. You need the full cost stack – including the internal hours that never appear on an invoice. You need a revenue model that survives someone in finance poking at it.
And you need to be straight about what attribution can and can’t prove, because a lot of “SEO ROI” reports are really just a guess with a percentage sign on the end.
This guide gives you the formula, the arithmetic, the benchmarks, and the caveats. In that order.
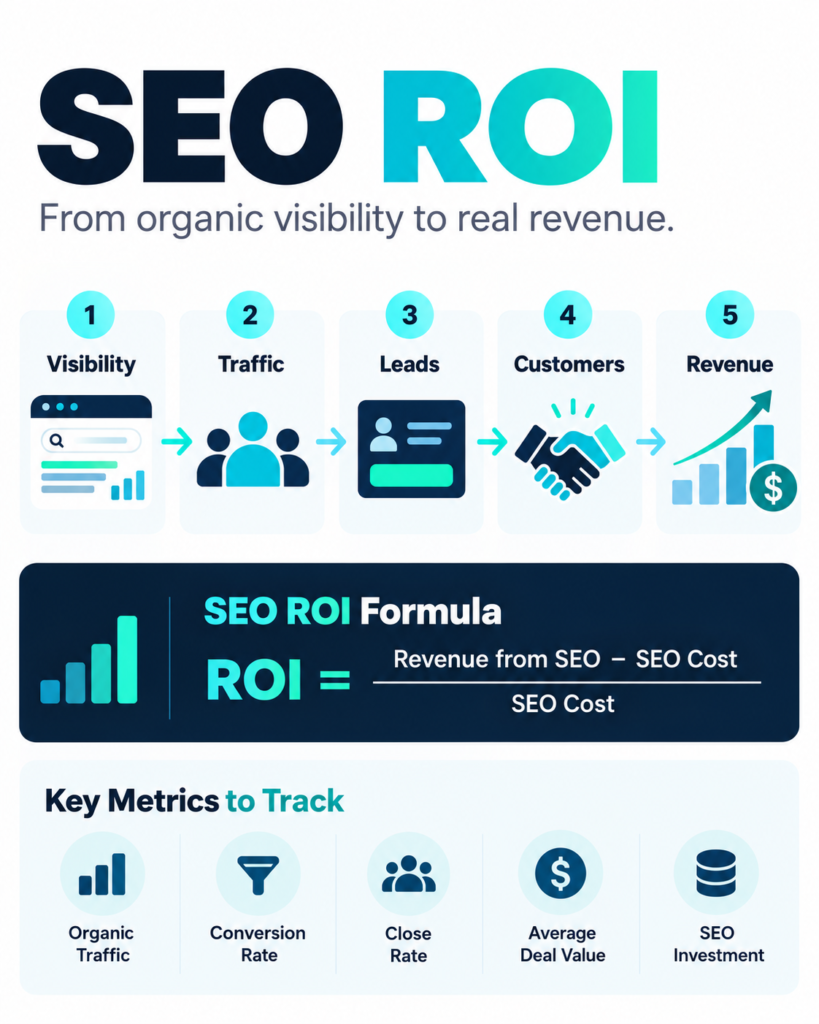
Key takeaways
- The core formula: (gross profit from organic − SEO cost) ÷ SEO cost × 100. Use gross profit, not revenue, if you want to compare SEO to paid.
- Most year-one SEO ROI looks bad. Cost lands in months 1–6; revenue arrives in months 7–18. That’s a cash-flow shape, not a failure.
- Last-click attribution systematically undercounts SEO. GA4’s data-driven model helps, but it doesn’t close the gap on its own.
- When attribution is unreliable, use proxies: incrementality tests, holdout markets, branded search volume, and self-reported pipeline.
- AI answer visibility is now a return channel. It shows up in your CRM late – or not at all – so measure it separately from revenue attribution.
The SEO ROI Formula
There’s one formula. Everything hard about SEO ROI is in how you fill in the two variables.
The Basic Calculation
SEO ROI = (Return − Cost) ÷ Cost × 100
Where:
- Return = gross profit generated by organic search in the period (revenue × gross margin). If you use revenue, you’re measuring SEO against paid media’s revenue-equivalent and quietly overstating the return.
- Cost = everything you spent on SEO in the period. Not just the agency invoice.
You’ll also see people quote a return multiple: Return ÷ Cost. A 3.2x multiple means every $1 spent came back as $3.20 of gross profit. Same number, different framing – pick one and stay with it.
Before you compute anything, decide five things and write them down:
- Time window. Twelve months, 24, or trailing four quarters. Shorter windows flatter paid and punish organic.
- Which revenue counts. New business only, or new plus expansion from customers originally won organically?
- Margin. Gross margin, contribution margin, or revenue? Be consistent, and say which.
- Branded vs non-branded. Branded organic clicks are often demand you created elsewhere. Report them separately or they’ll inflate the result.
- Assisted vs direct. One conversion can only be counted once in a direct model. Say whether you’re doing that.
Most SEO ROI calculators skip all five. That’s why their output looks clean and means very little.
A Worked Example
Take a mid-market B2B SaaS company. Sales-led, free trial, $9,000 average contract value.
| Input | Value |
|---|---|
| Period | 12 months |
| Blended SEO spend | $12,500/month → $150,000 |
| Organic sessions, months 1–12 | 40,000 (1,200/mo in January → 6,000/mo in December) |
| Non-brand visitor → lead | 1.2% |
| Lead → closed won | 10% |
| Average contract value | $9,000 |
| Gross margin | 80% |
| Comparable paid CAC | $4,800 |
Now the arithmetic, step by step:
- Leads = 40,000 × 1.2% = 480
- Customers = 480 × 10% = 48
- New revenue = 48 × $9,000 = $432,000
- Gross profit = $432,000 × 80% = $345,600
- SEO ROI = ($345,600 − $150,000) ÷ $150,000 = 130%
- Return multiple = $345,600 ÷ $150,000 = 2.3x
- Cost per organic acquisition = $150,000 ÷ 48 = $3,125 – roughly 35% below the $4,800 paid CAC
A 130% ROI in year one is decent. It’s also the boring part. Run the same model into year two, holding spend flat at $150,000:
- Sessions double to 80,000
- Leads = 80,000 × 1.2% = 960
- Customers = 960 × 10% = 96
- Revenue = 96 × $9,000 = $864,000
- Gross profit = $864,000 × 80% = $691,200
Two-year cumulative: $300,000 spent, $1,036,800 gross profit returned – a 246% ROI, or 3.5x. Nothing changed in the model except which year you’re looking at. That’s the compounding effect, and it’s the single biggest reason SEO ROI arguments go sideways.
What Goes Into the Cost Side
The rule is simple: if a cost disappears when you stop doing SEO, it belongs here.
The ranges below are 2026 market ranges we see in real quotes for mid-market clients. Treat them as directional, not as published averages.
| Cost category | Typical range | Notes |
|---|---|---|
| Content production | $300–$1,500 per article; $2,000–$6,000 for original research or data-led pieces | The largest line for most content-led programs. Cheap content that never ranks is the most expensive content you’ll buy. |
| Technical SEO | $2,000–$8,000 one-off; $1,500–$4,000/month ongoing | Crawl fixes, site speed, schema, migration work. Big one-off spikes in year one. |
| Link acquisition / digital PR | $150–$800 per link; $3,000–$10,000/month for campaigns | Paid guest posts are the low end and the fastest to devalue. Real digital PR costs more and holds longer. |
| Tooling | $200–$2,500/month | Rank tracking, crawling, log analysis, and now AI-visibility monitoring. |
| Internal time | 4–20 hours/month × fully loaded hourly cost | The line everyone forgets. A senior marketer at 8 hours a month and $90 fully loaded is $8,640/year that never appears on an invoice. |
| Agency or consulting fees | $2,500–$15,000/month retainer; $20,000+/month for enterprise | Should cover strategy and execution – not just a report you could have pulled yourself. |
Two things trip people up here.
Internal time is a real cost. If your head of marketing spends a Friday a month reviewing SEO work and writing briefs, that’s operating cost. Leave it out and your ROI is overstated by 5–15% in a typical mid-market setup.
Sunk costs aren’t SEO ROI. A site you rebuilt for other reasons, a designer already on payroll, a CMS you pay for anyway – those aren’t attributable to SEO. Put them in a “shared cost” note, not in the denominator.
What Goes Into the Return Side
Revenue attribution for SEO comes in four flavours. You need all four to get close to the truth, and none of them alone is enough.
Direct Revenue Attribution
The straightforward one: a session lands from organic search, converts in that same session, and your analytics platform records it.
Pull this from GA4, from server-side tracking, or from your CRM if the journey is long. Then split branded from non-branded – branded organic is largely the by-product of demand you generated through ads, PR, or word of mouth.
What direct attribution captures well: bottom-of-funnel queries. “Best X for Y”, “[competitor] alternatives”, pricing comparisons.
What it misses: everything with a thinking period longer than 30 minutes.
Assisted Conversions
Assisted conversions credit SEO for touching a journey that closed elsewhere – a demo booked after a second visit, a purchase made after a newsletter signup the blog prompted.
GA4 handles this through its attribution reporting section. You get data-driven, paid-and-organic last click, and Google paid channels last click. Google has retired the older first-click, linear, time-decay, and position-based models from GA4 entirely.
Two caveats matter more than they look:
- Data-driven attribution is a model, not a measurement. It estimates how touchpoints relate to conversion paths in your property’s data. It can give SEO credit. It doesn’t guarantee it, and it can’t see touchpoints GA4 can’t observe.
- Not every report uses your chosen model. Traffic acquisition reports use session-scoped channel attribution, so treat them as a different lens rather than a multi-touch view.
The practical move: run data-driven and last-click side by side, then look at organic landing pages and conversion paths. The gap between the two is the strongest evidence you’ll get about how much direct attribution is hiding.
Branded Search and Direct Traffic Lift
Here’s a return that almost never shows up in SEO dashboards, because it looks like brand demand.
When SEO works, branded search volume rises. People read your article, don’t convert, and three weeks later type your company name into Google. That click gets credited to organic branded – or to direct – and your SEO report says nothing.
Use Google Search Console to segment branded from non-branded queries and watch the branded trend against your content publishing schedule. If branded impressions climb 4–6 weeks behind content launches, you have a return signal that no last-click model will ever show you.
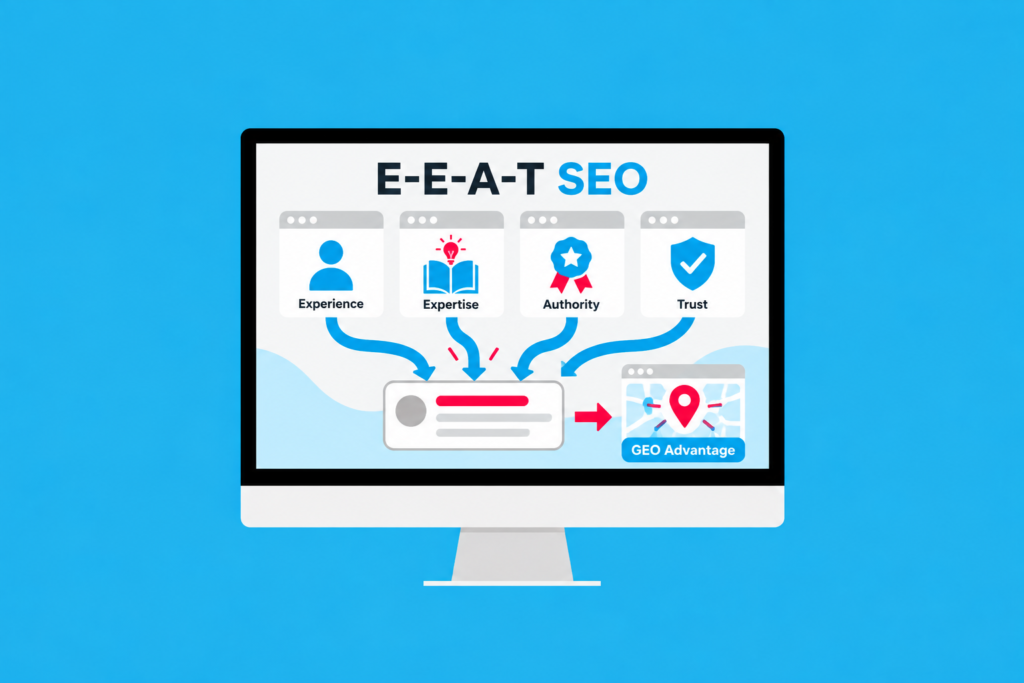
AI Answer Visibility (the new channel)
This is the newest and least-measured return channel, and it’s growing fast.
In Ahrefs’ February 2025 study of 3,000 websites, ChatGPT accounted for 50% of AI-referred visits, with Perplexity at just under a third. Those referrals land in your analytics as a referral – or don’t land at all, because the user got the answer inside the chat window.
Does AI traffic actually convert? This short Crescendo video shares the numbers behind how well AI-referred visitors perform.
You have to measure AI visibility in two places:
- Referral traffic from chatgpt.com, perplexity.ai, and Google AI surface URLs. Low volume, high intent, and consistently under-tracked. If your analytics is still lumping these into “referral,” see our guide to how to track AI traffic.
- Citations without clicks. Whether your brand appears in the answer at all. That’s a share-of-voice metric, not a traffic metric – and for high-consideration purchases it’s often the more valuable one.
If you want the short version of what to fix first, our GEO audit checklist walks through it step by step.
The Attribution Problem
Every SEO ROI number carries error bars. Pretending otherwise is how agencies lose trust in month nine.
Want a second take on proving SEO’s return? Moz’s Whiteboard Friday on the ROI of SEO covers how to think about the value organic search delivers.
Last-Click Undervalues SEO
Last-click gives 100% of the credit to the final touchpoint. In a considered purchase, organic search is usually the first or second touch and almost never the last one. Someone finds you through a comparison article, reads three more pages, leaves, comes back via a branded search, then converts after a sales call – and last-click hands the whole thing to the direct visit.
The size of the distortion depends on your sales cycle. For a $40 e-commerce order with a 10-minute decision, it’s small. For a $30,000 enterprise contract with six stakeholders over four months, last-click can easily report SEO at 20–40% of its actual contribution.
Fix it, partly: GA4’s data-driven attribution. Understand its limits: consent choices, cross-device journeys, offline sales, and CRM-side conversations all sit outside what the model can see. Data-driven attribution narrows the error. It doesn’t eliminate it.
Why SEO ROI Looks Worse Than Paid in Year One
Paid media and SEO have almost opposite cash-flow shapes. That’s the whole story.
- Paid: spend in month one, revenue in month one. Costs and returns are matched, so the ROI number is meaningful within weeks.
- SEO: spend in months 1–6 building assets, revenue from months 7–18 as pages mature and accumulate links. Costs are front-loaded, returns are back-loaded.
A comparison of 12-month ROIs between the two will almost always favour paid. Not because paid is better, but because you’re comparing a completed cycle to a half-finished one.
Two useful fixes:
- Extend the window. Run everything over 24 months. The gap narrows, and usually reverses.
- Use payback period instead. How many months until cumulative organic gross profit exceeds cumulative SEO spend? That’s the number a CFO can actually act on.
For context on what “normal” looks like, First Page Sage’s 2025 benchmark report puts median B2B SaaS CAC payback at 18 months. If your SEO payback lands under that, SEO is beating the house average before you even argue about attribution.
Worth keeping in perspective: Ahrefs found that only 5.7% of roughly 2 million pages studied reached Google’s top 10 within a year. Timelines are long. Plan accordingly.
The Compounding Effect and How to Model It
Organic content doesn’t depreciate the way an ad campaign does. A page that ranks does three things simultaneously: it keeps earning, it attracts links that strengthen the whole domain, and it makes adjacent pages easier to rank. That’s compounding – but it’s not automatic and it isn’t exponential forever.
A defensible way to model it in a spreadsheet:
- Year 1: sessions grow roughly linearly from your starting baseline. Assume 60–70% of year-one revenue lands in the back half.
- Year 2: assume organic sessions grow 40–100% with flat-to-modest spend increases. Existing pages improve, and new pages from year one start contributing.
- Year 3+: assume growth flattens to 15–30% per year as you saturate your addressable keywords.
Then stress-test it. Cut the year-two growth rate in half and see whether the investment still clears your payback threshold. If it only works under the optimistic case, you’re not modelling – you’re forecasting a wish.
Also budget for content decay. Pages lose rankings. Google updates reset assumptions overnight. In any mature content library, expect to rewrite or consolidate 10–20% of URLs a year just to hold position.
Benchmarks: What Good Looks Like
Four things to say before you read this table. These are the ranges we use as sanity checks when auditing a program, not universal law. B2B SaaS and e-commerce are not comparable – one converts to leads, the other to orders. Judge SEO against your own paid channels first, then against these. And the “average” column is where most competent programs sit, which is to say: unremarkable but working.
| Metric | Weak | Average | Strong |
|---|---|---|---|
| Non-brand organic conversion rate | Under 0.6% | 0.8–1.5% | Above 2% |
| Cost per organic acquisition | Above $4,000 | $1,500–$4,000 | Under $1,000 |
| Time to first attributed revenue | Over 9 months | 4–9 months | 2–4 months |
| Organic share of total revenue | Under 5% | 10–20% | Above 30% |
| Payback period on SEO spend | Over 24 months | 12–18 months | Under 8 months |
| Assisted-conversion ratio (assists ÷ direct) | Under 0.5 | 1–2 | Above 3 |
Two notes on reading these. The conversion-rate row is a B2B lead benchmark; organic e-commerce session-to-order typically runs 2–3%, so adjust the scale rather than concluding you’re exceptional. And the assisted-conversion ratio is the honest one – if SEO assists fewer conversions than it directly closes, either your tracking is incomplete or your content isn’t reaching the top of the funnel.
How to Measure SEO ROI When You Cannot Attribute Cleanly
Sometimes the analytics is a mess, the CRM doesn’t join to the web session, or the sales team lives on the phone. You still have to make a decision. Four methods, roughly in order of strength.
Incrementality Testing
Instead of asking “which touchpoint gets credit,” ask “what would have happened without the work?”
That’s incrementality: run the change in one group, withhold it from a comparable group, and compare the difference. Google’s own guidance on marketing incrementality is a good primer on the logic.
For SEO specifically, a page- or query-level test is usually more practical than a full-site change. Randomise a comparable set of URLs, apply the optimisation to half, leave the other half alone, and measure the gap in non-brand clicks and conversions over 8–12 weeks.
Holdout Markets
A geographic holdout works well when the intervention is genuinely local – region-specific landing pages, localised content, market-specific schema.
The design matters more than the tooling:
- Match markets on pre-period traffic, conversion rate, and demand seasonality.
- Run treatment and control simultaneously.
- Compute the lift as (treatment post − treatment pre) − (control post − control pre).
- Report a confidence range, not a single number.
One trap specific to SEO: a national site change can leak into control markets through shared internal links and sitewide templates. If you can’t genuinely withhold the change, use a page-level holdout instead. The causal claim comes from the design, not from a before-and-after increase.
Branded Search as a Proxy
When organic visibility rises, branded search follows. It’s imprecise and it lags, but it’s directionally reliable and it’s unaffected by attribution model choices.
Track branded impressions in Search Console, month over month, against your publishing and link-building calendar. Do not use it as a revenue number. Use it as a leading indicator – the thing that moves three to six weeks before pipeline does.
Pipeline and Self-Reported Attribution
The most underrated method in B2B: ask people.
Add “How did you first hear about us?” to your demo form. It’s one field, the completion rate is high, and it catches the journeys your analytics loses. Then reconcile it against CRM source data and channel your sales team hears on calls.
On a recent audit, self-reported attribution attributed roughly 30% more pipeline to organic search than last-click did. Neither figure was “correct.” The truth sat between them, and the gap was the useful part – it told us which queries and pages were starting journeys rather than ending them.
Use Case 1 – B2B SaaS Calculates a 4.2x Return Over 24 Months
The client: a mid-market B2B SaaS platform, $28,000 average contract value, sales-led with a free trial.
The setup: they were spending $22,000/month blended (agency, content, technical, tooling, internal time) and had no idea whether it worked. Their last-click report showed SEO driving 6% of new revenue.
Here’s what the 24-month model actually looked like.
| Year 1 | Year 2 | |
|---|---|---|
| Organic sessions | 34,000 | 90,000 |
| Sessions → lead | 0.9% | 1.1% |
| Leads | 306 | 990 |
| Lead → closed won | 7% | 8% |
| Customers | 22 | 80 |
| New revenue | $616,000 | $2,240,000 |
Totals over 24 months:
- Total SEO spend = $22,000 × 24 = $528,000
- Total new revenue = $616,000 + $2,240,000 = $2,856,000
- Gross profit at 78% margin = $2,227,680
- Return multiple = $2,227,680 ÷ $528,000 = 4.2x
- Cost per organic acquisition = $528,000 ÷ 102 customers = $5,176, against a paid CAC of $11,000
- Cost per lead = $528,000 ÷ 1,296 = $407
Three things made this case instructive rather than just flattering.
The first five months produced almost nothing. Under 4% of the 24-month value arrived before month six. If the client had reviewed at month four, they’d have cancelled.
The 4.2x excludes assisted conversions entirely. Self-reported attribution put the organic contribution closer to 28% of new business, against 9% from last-click. We modelled the conservative number.
The margin math is the load-bearing part. Using revenue instead of gross profit, the return multiple looks like 5.4x. That’s how most agency case studies get inflated – they divide revenue by spend and never mention margin.
Use Case 2 – E-commerce Brand Discovers Its SEO ROI Was Negative on Half Its Content
The client: a direct-to-consumer home goods brand, roughly $8M annual revenue, doing SEO in-house with a freelance content writer.
The setup: 180 blog posts published over 18 months. The team believed content marketing was working – traffic was up, after all. Nobody had run the numbers per page.
Content cost: 180 posts × $600 = $108,000. Technical work and tooling over the same period: $18,000. Total: $126,000.
Attributed revenue from non-brand organic (last-click plus self-reported): $96,000. At a 42% gross margin, that’s $40,320 of gross profit.
Overall SEO ROI = ($40,320 − $126,000) ÷ $126,000 = −68%
Then they segmented by page, and the picture split in three:
| Segment | Pages | Revenue | Gross profit | Cost | ROI |
|---|---|---|---|---|---|
| Top performers | 18 | $68,000 | $28,560 | $10,800 | +164% |
| Middle | 54 | $24,000 | $10,080 | $32,400 | −69% |
| Bottom | 108 | $4,000 | $1,680 | $64,800 | −97% |
Half the library – the bottom 90 pages – cost $54,000 and returned $1,470 in gross profit. A −97% ROI, hidden behind a single aggregate traffic number.
The diagnosis was unglamorous. Of those 90 pages, 62 were pure informational posts targeting questions nobody buys from, published with no internal links to product or category pages. Average engaged time was under 30 seconds. Eighteen had never received a single click from search.
The fix took two quarters:
- 41 posts consolidated into 9 stronger pages, with 301 redirects
- Internal links added from every surviving post to a relevant category page
- The remaining pages rewritten to answer the query in the first 100 words, in a format an AI model can quote
- Publishing halted on informational topics with no commercial intent
Six months later the site had 130 published pages instead of 180, and organic revenue was running at $22,000 a quarter versus $16,000 – a 38% lift on 28% fewer pages. Spend stayed flat.
The lesson isn’t “content doesn’t work.” It’s that aggregate SEO ROI hides page-level ROI, and page-level ROI is the only one you can act on.
The scope behind the cost matters. An international SEO programme may include localisation and market-specific review; SEO for Bangkok and Thailand may focus on local service enquiries. For AEO agency work, separate observed visibility from attributable visits and sales. Compare agreed work and commercial outcomes rather than treating a mention count as revenue.
How Crescendo Models SEO and GEO Return
We model in three layers, because mixing them is how ROI reporting gets dishonest.
Layer 1 – Visibility. Impressions, non-brand keyword coverage, AI citations, and share of the prompts that matter in your category. Nothing here is revenue, and we don’t pretend it is.
Layer 2 – Demand. Non-brand organic sessions, qualified leads, and – where the data allows – pipeline created. This is where you can see whether visibility is translating into interest.
Layer 3 – Revenue. Closed-won attributed to organic through direct, assisted, and self-reported models, reconciled against CRM data.
The reason for the separation: layers 1 and 2 move in weeks, layer 3 moves in quarters. Reporting them as one blended figure forces you to either overclaim early or underclaim late.
Our client results give a sense of scale. Across programs we’ve seen +70% more AI mentions, 3x brand recall, and an +8% revenue lift. Individually: a legal services client added +23% inbound leads in four months, a UK telco saw +40% more leads across all channels, and a global fintech grew organic traffic by 50% while competing with Stripe and PayPal on a fraction of their paid budget.
What we don’t claim is that those numbers are directly attributable to a single channel. They’re program results measured against pre-launch baselines, and we say so in every deck. Our AEO services cover the AI-visibility side; Clairon is the measurement layer we use to track citations and prompt-level positioning.
Crescendo’s Take
We refuse to quote a single ROI number before month six. Not because we’re being coy – because a 90-day SEO ROI figure is noise dressed as evidence. Costs are all in, returns are barely started, and the number you’d produce would be worse than useless. It would be used against you in a budget meeting by someone who’d never read the method.
In the first two quarters, we track citation share instead of ROI. Specifically: how many of your target prompts you appear in, and how many you’re the first recommendation on. For AI-mediated categories that’s the leading indicator that actually predicts revenue. A brand that’s first-recommended on 12 of 40 prompts in quarter one tends to look very different by quarter three – and unlike an ROI projection, it’s a measurement, not a forecast.
Here’s what most agencies hide about payback periods. A lot of them quote payback in “6–9 months.” That’s achievable if you count revenue from branded searches you’d have received anyway. Strip branded out and payback on a genuine non-brand program is usually 12–18 months for B2B and 6–12 months for e-commerce. Any agency promising shorter without a very specific reason is either counting branded traffic or about to under-deliver.
AI visibility changes the ROI model in one specific way. It adds a channel that generates revenue without generating sessions. Someone asks ChatGPT for the best tool in your category, gets your name, and goes straight to your site by typing the URL. That journey looks like direct traffic, gets credited to brand, and never touches your organic report. The ROI is real. The attribution is invisible. Which means the model has to be built around incremental branded and direct lift, not around session-level attribution – and most analytics stacks aren’t set up for that yet.
If you’re building the case internally, our advice is boring and it works: run the model over 24 months, present payback period instead of ROI, and show the conservative number. Nobody ever got fired for under-promising on SEO.
FAQ
What is a good SEO ROI?
There’s no universal number, but as a working range: 2x to 5x return multiple over 24 months is a solid outcome for a B2B program, and payback inside 18 months puts you ahead of the median B2B SaaS CAC payback benchmark. Year-one ROI on its own is a poor yardstick – a 100–150% first-year ROI is normal for a program that will go on to return 3–5x. Judge against your own paid channels, where you have a real cost-per-acquisition you already trust.
How do you calculate SEO ROI step by step?
Five steps. (1) Add up every SEO cost for the period – agency, content, links, tooling, and internal hours. (2) Count organic leads or orders, excluding branded where you can. (3) Multiply by your conversion-to-customer rate and average order or contract value. (4) Multiply by gross margin to get gross profit. (5) Divide (gross profit − cost) by cost and multiply by 100. Worked example: $150,000 cost, $432,000 revenue, 80% margin = $345,600 gross profit = 130% ROI.
How do you measure SEO ROI when you can’t attribute conversions?
Use four methods in combination: an incrementality test on a randomised set of URLs, a geographic holdout where the intervention is genuinely local, branded search impressions in Search Console as a leading indicator, and self-reported attribution on your lead forms. Reconcile all four and report a range rather than a point estimate. In B2B, self-reported attribution alone often reveals 25–30% more organic pipeline than last-click credit shows.
Why does SEO ROI look worse than paid search in year one?
Because the two channels have inverted cash flows. Paid media matches spend and revenue inside the same month. SEO front-loads cost across months 1–6 and back-loads revenue into months 7–18. Comparing 12-month ROIs puts a half-finished cycle against a completed one – paid wins by construction. Extend the window to 24 months, or switch to payback period, and the comparison becomes meaningful.
How long does SEO take to pay back?
For e-commerce, 6–12 months is a realistic range for a program starting from a site with existing domain authority. For B2B, 12–18 months is more typical because the sales cycle sits on top of the ranking timeline. Both estimates assume you exclude branded organic revenue. Ahrefs found only 5.7% of roughly 2 million pages studied reached Google’s top 10 within a year, so plan around quarters, not weeks.
Does AI search change SEO ROI?
Yes, in two ways. It adds a return channel – Ahrefs’ February 2025 study of 3,000 sites found ChatGPT generated 50% of AI-referred visits – and it creates revenue that never shows up as a session. Some buyers see your brand in an AI answer and arrive later by typing your URL, which records as direct traffic. Practically, that means model incremental branded and direct lift, not just organic sessions, and track prompt-level visibility separately from revenue.